
‘India saw a 15 % increase in foreign tourist arrivals’, reported several news sites. The source of the information was a PIB release from August 16, 2017.
The PIB release stated, ‘7.4% growth in Foreign Tourist arrivals in July, 2017 over July, 2016. 73.3% growth in Foreign Tourist arrivals on e-Tourist Visa in July, 2017 over July, 2016.’
While July 2017 saw a 7.4% increase in Foreign Tourist Arrivals (FTAs) compared to July 2016, the period Jan- July 2017 saw a 15% jump in FTAs compared to Jan-July 2016.
By showing the increase in FTAs alongside the increase in FTAs on e-tourist visa, the quick assumption that could be made is - FTAs have increased due to e-visa.
This was the case with a Business Standard article which reported– ‘India sees over 15% growth in foreign tourist arrivals thanks to e-visa’.
Has the launch of e-visa prompted the increase in FTAs?
E-visa introduced in November 2014 enables tourists to apply for a visa online. The tourist receives an authorization email to be produced at the immigration check point.
BOOM in June 2017 fact checked an infographic shared by Minister Ravi Shankar Prasad and reported that there is not sufficient data to claim that increase in FTAs is as result of the launch of E-visa.
BOOM checks if the growth of FTAs can be attributed to e-visa with data available till July 2017.
FTA’s over time
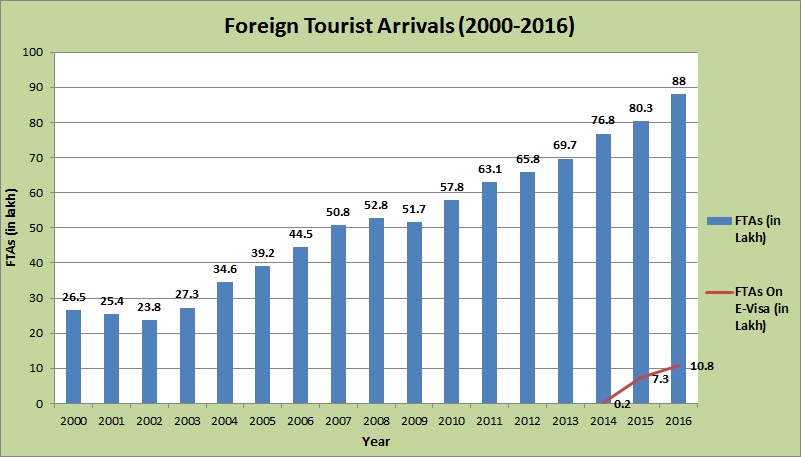
Foreign tourist arrivals have seen an upward curve between 2000- 2016, except for marginal falls in the years 2002 and 2009.
Chart 01: Foreign Tourist Arrivals (2000-16)
Source: Ministry of Tourism
In 2016, FTAs saw a 3 fold growth since 2000 and 1.5 fold growth since 2008.
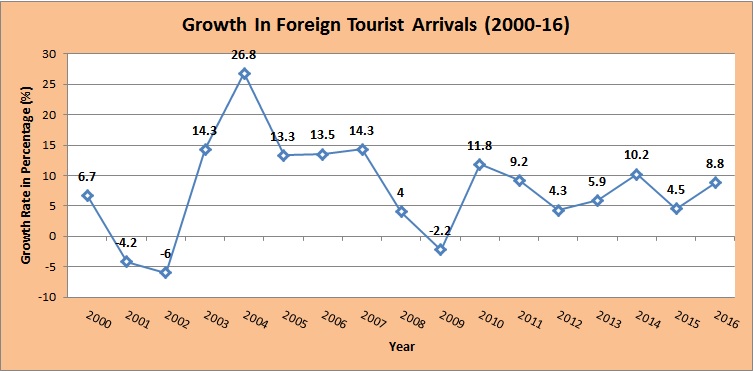
The average rate of growth over these years is 8%. The highest growth was recorded in 2004 (26.8%). The years, 2002 and 2009, witnessed a 6% and 2% fall, respectively.
Chart 02: Growth In Foreign Tourist Arrivals
Source: Ministry of Tourism
FTAs on E-visa
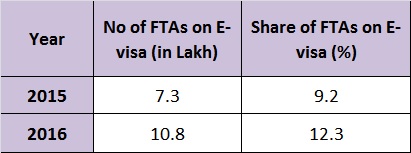
The share of tourists applying for e-visa (launched in Nov 2014) has increased over time. It saw a 48% jump from 7.3 lakh to 10.8 lakh between 2015 to 2016.
In 2015, 9.2% of FTAs applied for an e-visa while in 2016 it was 12.3%.
Though the share of FTAs on e-visas has increased since its inception in 2014, total FTAs though have increased, did not see a significant jump distinct from previous years.
Chart 02 shows that while in 2014, FTAs grew by 10.2%, in 2015 it slowed down to 4.5% and picked up to 8.8% in 2016. The fluctuation in the rate of growth of FTA’s (post launch of e-visa) shows there has not been a consistent upward trend in growth between 2014 – 16.
Table 01: FTAs on E-Visa (2015-16)
Source: Ministry of Tourism
FTAs in 2017
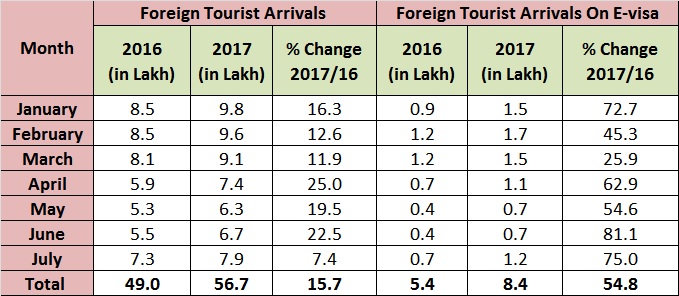
The growth of FTAs and the share of FTAs on e-visa in 2017 compared to 2016 is shown below. FTAs have increased by 15.6% and FTAs on E-visa by 54.8% upon comparing the period Jan- July 2017 with Jan-July 2016.
Table 02: Jan- July 2016 vs Jan-July 2017 Comparison of FTAs
Source: Ministry of Tourism & PIB releases
How has e-visa fared in Top 15 source countries of FTAs?
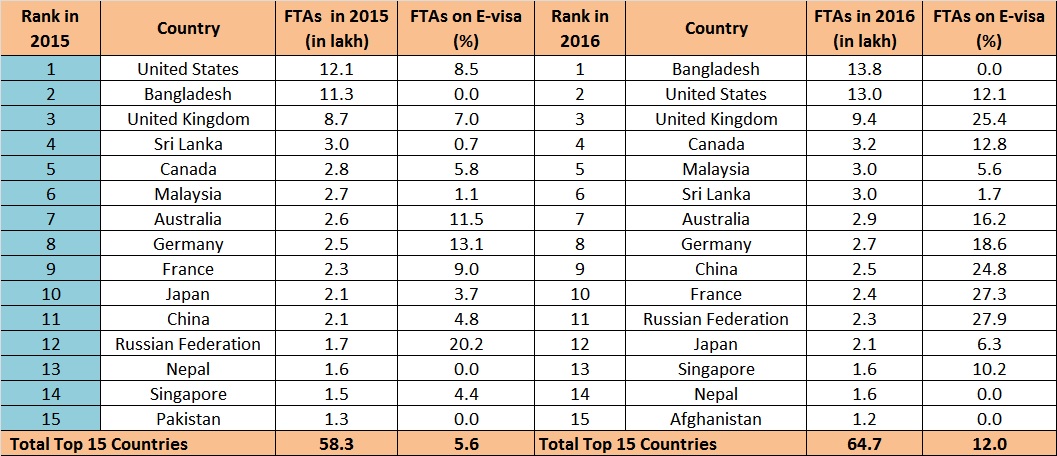
In 2016, from top 15 countries which contributed to 73.5% of FTAs, 12% were FTAs on e-visa.
In 2015, from top 15 countries which contributed to 72.6% of FTAs, 5.6% were FTAs on e-visa.
Table 03 : Top 15 Source Countries for FTAs in India during 2016 & 2015
Source: Ministry of Tourism
NOTE 1: Till 2016, e-visa scheme has not been extended to Nepal, Bangladesh, Afghanistan and Pakistan. As of now, nationals of 162 countries can avail the e-visa facility. Click here for the list.
NOTE 2: Country wise data for the year 2017 is not yet available.
We see that Bangladesh without being extended the e-visa facility contributes the highest FTAs as of 2016.
In 2016, tourists from Russia (27.9%) and France (27.3%) have availed e-visa facility the most.
Though tourists from US and UK (2nd and 3rd highest FTAs) have increasingly availed e-visa facility, we do not see a significant jump in FTAs.
Have FTA’s increased from countries who avail e-visa facility the most?
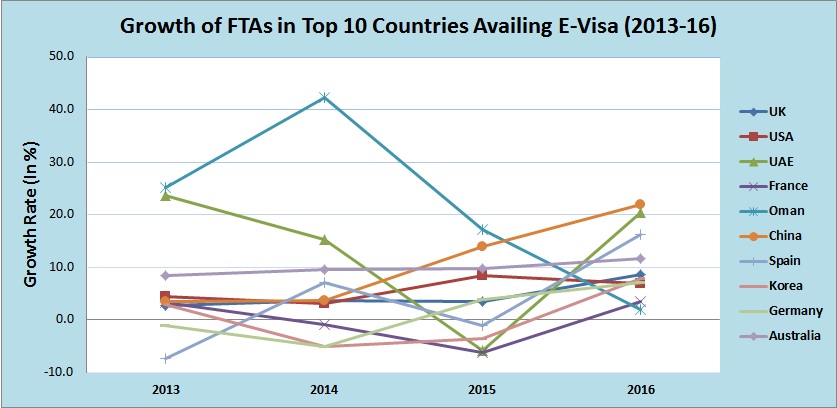
As per the August press release, the top 10 countries that use e-visa facility the most are – UK, USA, UAE, France, Oman, China, Spain, Korea, Germany and Australia.
Chart 03: Growth of FTAs in Top Countries availing E-visa facility the most
Source: Ministry of Tourism
Growth of FTAs in China, Korea, Germany and Australia have accelerated since 2015 (post launch of e-visa). Oman has seen a clear decline. UK and USA (among the highest contributers of FTAs) have not accelerated in a significant manner, while France, UAE and Spain have seen increase in 2016.
This shows that there is not a definite and uniform pattern of growth in FTAs in these countries, post the launch of e-visa. The reason could be that the impact of e-visa is country specific or multiple factors determine the growth of FTA’s.
Though both FTAs and FTAs on e-visa have increased, the data do not establish a clear causative link between increase in FTAs and e-visa.
While e-visa is definitely a great step towards easing visa application and attracting more tourists, it is not the sole determinant of FTAs.