The 10 hottest years on record have now all occurred after 2000 and temperatures have increased at a rate of 0.03 °C for every year from 2000 to 2015, indicative of a larger trend of global warming. The city of Mumbai has seen an average annual increase of more than 2 °C in the last century.
With 2015 now the hottest year since records started being kept 135 years ago, Delhi, Mumbai and other Indian cities have heated up substantially since the 19th and 20th centuries, data from the US National Aeronautics and Space Administration (NASA) reveal.
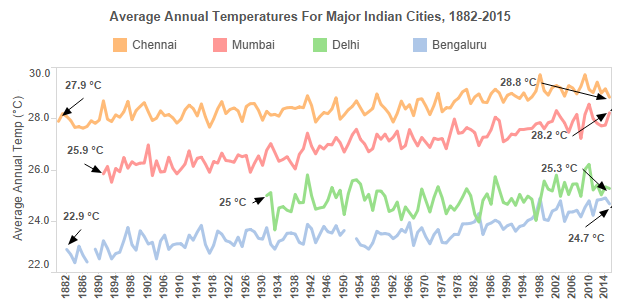
Mumbai’s average annual temperature has risen 2.4 °C since 1891 and Delhi’s average annual temperature has risen 0.3 °C since 1930, as the following chart indicates:

Source: NASA
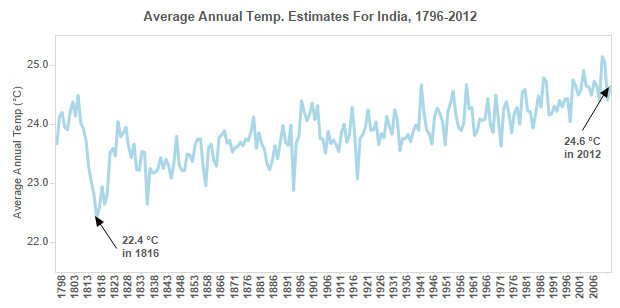
An alternative study from Berkeleyearth.org, a US non-profit that analyses climate science, appears to confirm the larger trend seen in the temperature rise in India: A rise of 2.2 °C over 200 years.

Source: BerkeleyEarth.org
Finland, Spain experience greatest warming
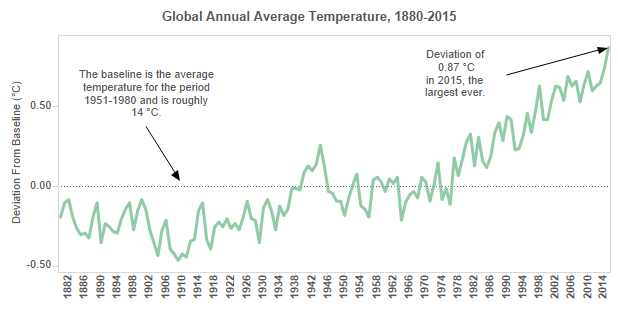
NASA took data from 6,300 weather stations around the world and compared it to a baseline, which is the average temperature from 1951-1980 (and can be taken roughly as 14°C). In 2015, the temperature deviation from the baseline was 0.87 °C, making it the hottest year since last year (2014), when the global temperature was 0.74 °C above the baseline.

Source: NASA
The 10 hottest years on record have now all occurred after 2000 and deviations from the baseline have increased at a rate of 0.03 °C for every year from 2000 to 2015, indicative of a larger trend of global warming.
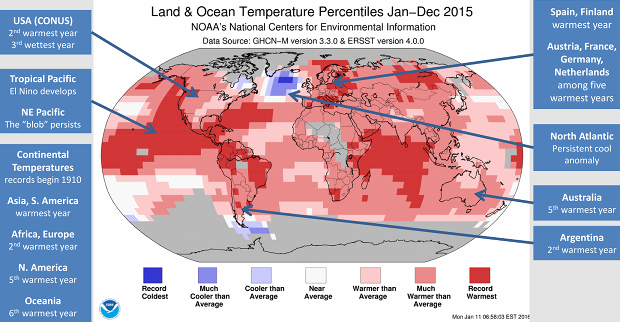
Finland and Spain had their warmest years ever while Argentina had its 2nd warmest year. In the long term, the biggest temperature increases have occurred around the poles, while temperatures around the equator haven’t changed much, according to this report on PBS.org.

Source: National Oceanic and Atmospheric Administration, USA
A closer look at the map also shows there is no region untouched by warming. “Further affirmation of the reality of the warming is its spatial distribution, which has largest values at locations remote from any local human influence,” a NASA statement said.
Most of the weather stations around the world are in the northern hemisphere, where most of the earth’s land mass is located. This means we do not really have a good idea of how the southern hemisphere, which is mostly ocean, has heated up. So, global warming could be underestimated, according to this report from realclimate.org, a commentary site on climate science.
Could El Niño play a role in global warming?
It would be easy to blame human activity and greenhouse gases for the warming, but according to some scientists, while that may not be possible for a single year, it does adequately explain the longer trend.
“[A] specific year [being the warmest]…is not attributable to greenhouse gases per se…but the long-term trend … is attributable,” said Gavin Schmidt, director of NASA’s Goddard Institute of Space Studies in 2015.
A role in warming the world, and parts of India, in 2015 can also be attributed to the complex phenomenon called El Niño, a vast ocean-atmosphere climate interaction in parts of the Pacific ocean, linked to warmer sea-surface temperatures. IndiaSpend has reported how El Niño in 2015 brought a more intense heatwave in northern India and a weaker monsoon.
The fact that there were record hot years, such as 2014, without an El Nino is seen as further evidence of global warming.
What could the warming lead to?
More flooding in Europe, water shortages in Africa, droughts in Asia and wildfires in North America.
These are some of the effects that could result if the earth’s warming continues, the Intergovernmental Panel On Climate Change, a United Nations agency responsible for investigating the effects of global warming, predicted in a 2014 report.
Countries around the world took their most significant step yet at COP21, the Paris climate change conference. (IndiaSpend has reported on India’s position at the summit here.) Agreeing to keep the rise in global temperatures in 2030 to under 2 °C from pre-industrial times, while striving for a 1.5 °C rise, will go a long way, but, to borrow a proverb, the proof will be in the pudding.
This article was republished from IndiaSpend.org.